Tutorial: Use GitLab Observability with a Ruby on Rails application
DETAILS: Tier: Ultimate Offering: GitLab.com Status: Beta
FLAG: The availability of this feature is controlled by a feature flag. For more information, see the history of the Distributed tracing feature.
In this tutorial, you'll learn how to create, configure, instrument, and monitor a Ruby on Rails application using GitLab Observability features.
Before you begin
Take a moment and make sure you have the following:
- A GitLab Ultimate subscription for GitLab.com
- A local installation of Ruby on Rails
- Basic knowledge of Git, Ruby on Rails, and the core concepts of OpenTelemetry
Create a new GitLab project
First, create a new GitLab project and a corresponding access token.
This tutorial uses the project name animals.
- On the left sidebar, at the top, select Create new ({plus}) and New project/repository.
- Select Create blank project.
- Enter the project details.
- In the Project name field, enter
animals.
- In the Project name field, enter
- Select Create project.
- In the
animalsproject, on the left sidebar, select Settings > Access tokens. - Create a new access token with the Owner role and the
read_apiandwrite_observabilityscopes. Store the token value somewhere safe—you'll need it later.
Create a Rails application
Next, we need a new Ruby on Rails application that we can instrument. For this tutorial, let's create a toy application to store a list of animals.
To create an application:
-
From the command line, run the following:
rails new animals -
Go to the
animalsdirectory and run the application:cd animals rails server -p 8080 -
In a web browser, visit
http://localhost:8080and make sure the application is running correctly. -
Create a model scaffold for an Animal class and run the generated database migrations:
rails generate scaffold Animal species:string number_of_legs:integer dangerous:boolean rails db:migrate -
Run the application again and visit the list of animals at
http://localhost:8080/animals. Try creating, editing, and deleting an animal to make sure everything works as expected. -
Add the OpenTelemetry and dotenv gems to the Gemfile:
bundle add opentelemetry-sdk opentelemetry-instrumentation-all opentelemetry-exporter-otlp dotenv -
Create an initializer to handle the configuration, and add an
.envfile to store environment variables:touch config/initializers/opentelemetry.rb touch .env -
Edit
config/initializers/opentelemetry.rband add the following code:require 'opentelemetry/sdk' require 'opentelemetry/instrumentation/all' require 'opentelemetry-exporter-otlp' OpenTelemetry::SDK.configure do |c| c.service_name = 'animals-rails' c.use_all() end -
Find your group ID:
- On the left sidebar, select Search or go to and find the top-level group with the
animalproject. For example, if your project URL ishttps://gitlab.com/tankui/observability/animal, the top-level group istanuki. - On the group overview page, in the upper-right corner, select Actions ({ellipsis_v}).
- Select Copy group ID. Save the copied ID for later.
- On the left sidebar, select Search or go to and find the top-level group with the
-
Find your project ID:
- On the
animalproject overview page, in the upper-right corner, select Actions ({ellipsis_v}). - Select Copy project ID. Save the copied ID for later.
- On the
-
Edit
.envand add the following code:OTEL_EXPORTER = "otlphttp" OTEL_EXPORTER_OTLP_ENDPOINT = "https://observe.gitlab.com/v3/{{GROUP_ID}}/{{PROJECT_ID}}/ingest" OTEL_EXPORTER_OTLP_HEADERS = "PRIVATE-TOKEN={{ACCESS_TOKEN}}" OTEL_LOG_LEVEL = "debug"Be sure to replace the
GROUP_ID,PROJECT_ID, andACCESS_TOKENwith the values you obtained earlier.
View traces
Now that you have an application configured to use Observability tracing, you can view exported traces on GitLab.com.
To view exported traces:
-
Start the
animalsapplication again. -
Visit
http://localhost:8080/animalsand perform some actions in the application. -
In the
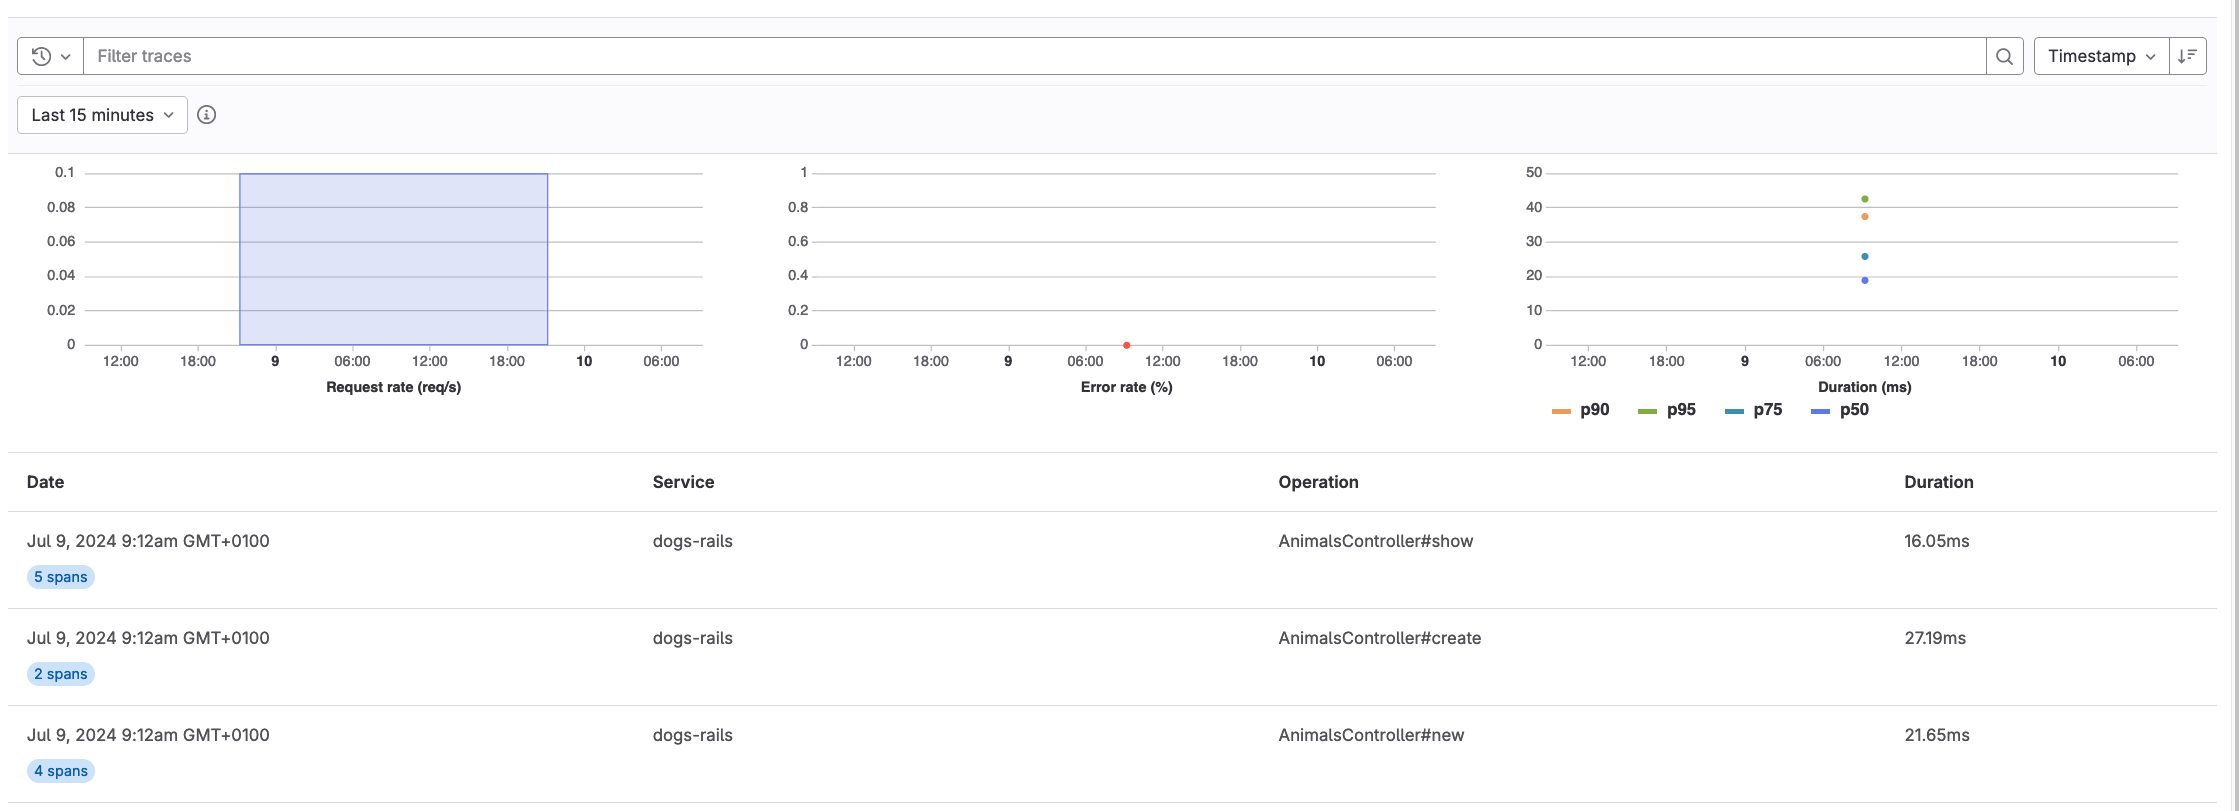
animalsproject, on the left sidebar, select Monitor > Traces. If everything is working correctly, you should see a trace for each controller action. -
Optional. Select a trace to view its span.
Congratulations! You successfully created an application, configured it to use GitLab Observability features, and examined the traces the application created. You can continue to experiment with this toy application, or try configuring a more complex application to export traces.
Remember that Observability Tracing is not yet ready for production use. There is no official support for logs or metrics using the OpenTelemetry collector with a Ruby on Rails application.

